Set up Visual Studio Code
Contents
Set up Visual Studio Code#
There are two approaches to creating, compiling and running C programs you will write. The first approach is to use a separate tool to perform each of these actions — a text editor to create the program file, a compile command to compile it, and another command to run it. The second approach is to use an Integrated Development Environment (IDE), which allows you to perform many tasks from a single, usually graphical, application.
VS Code is the most popular IDE among developers in 20231.
For Windows Users#
You can follow along the following video for steps on setting up VS Code on Windows. Brief steps are also provided below.
[Step 1] Go to code.visualstudio.com, and download VS Code. It will take seconds.
[Step 2] Click on the downloaded file to open it. Accept the agreement, and press Next and Install when appropriate. Make sure to tick Create a Desktop icon. It takes a few more seconds. Then press Finish.
[Step 3] Follow the following steps taken from steps 1 to 6 in https://www.msys2.org/.
Download the installer by clicking msys2.exe
Run/double click on the downloaded file
When asked about the installer folder, choose
C:\msys64When done, make sure “Run MSYS2 now” is selected and click “Finish”
In the black window that pops, type in
pacman -S mingw-w64-ucrt-x86_64-gcc, and press “Enter”Press “Enter” again to proceed with installation.
[Step 4] Additionally, you need to run the following command in the same MSYS2 UCRT64 terminal. This is taken from step 5 in https://code.visualstudio.com/docs/cpp/config-mingw.
pacman -S --needed base-devel mingw-w64-ucrt-x86_64-toolchain
Press “Enter” to accept the default option. This will take a few minutes.
[Step 5] In the MSYS2 UCRT64 terminal, type in the following commands to make sure the compiler and debugger are installed. If you do not see something similar to the expected output, do not proceed. Either repeat the steps or seek help.
Command 1
gcc --version
Expected output
gcc.exe (Rev2, Built by MSYS2 project) 13.2.0
Command 2
gdb --version
Expected output
GNU gdb (GDB) 13.2
Command 3
g++ --version
Expected output
g++.exe (Rev2, Built by MSYS2 project) 13.2.0
[Step 6] Go to Settings using the search at the bottom left. In {\bf Find a setting}, search for “Edit environment variables for your account”. Click on Path, and click Edit. In the new window, press New on the right and add C:\msys64\ucrt64\bin and click OK.
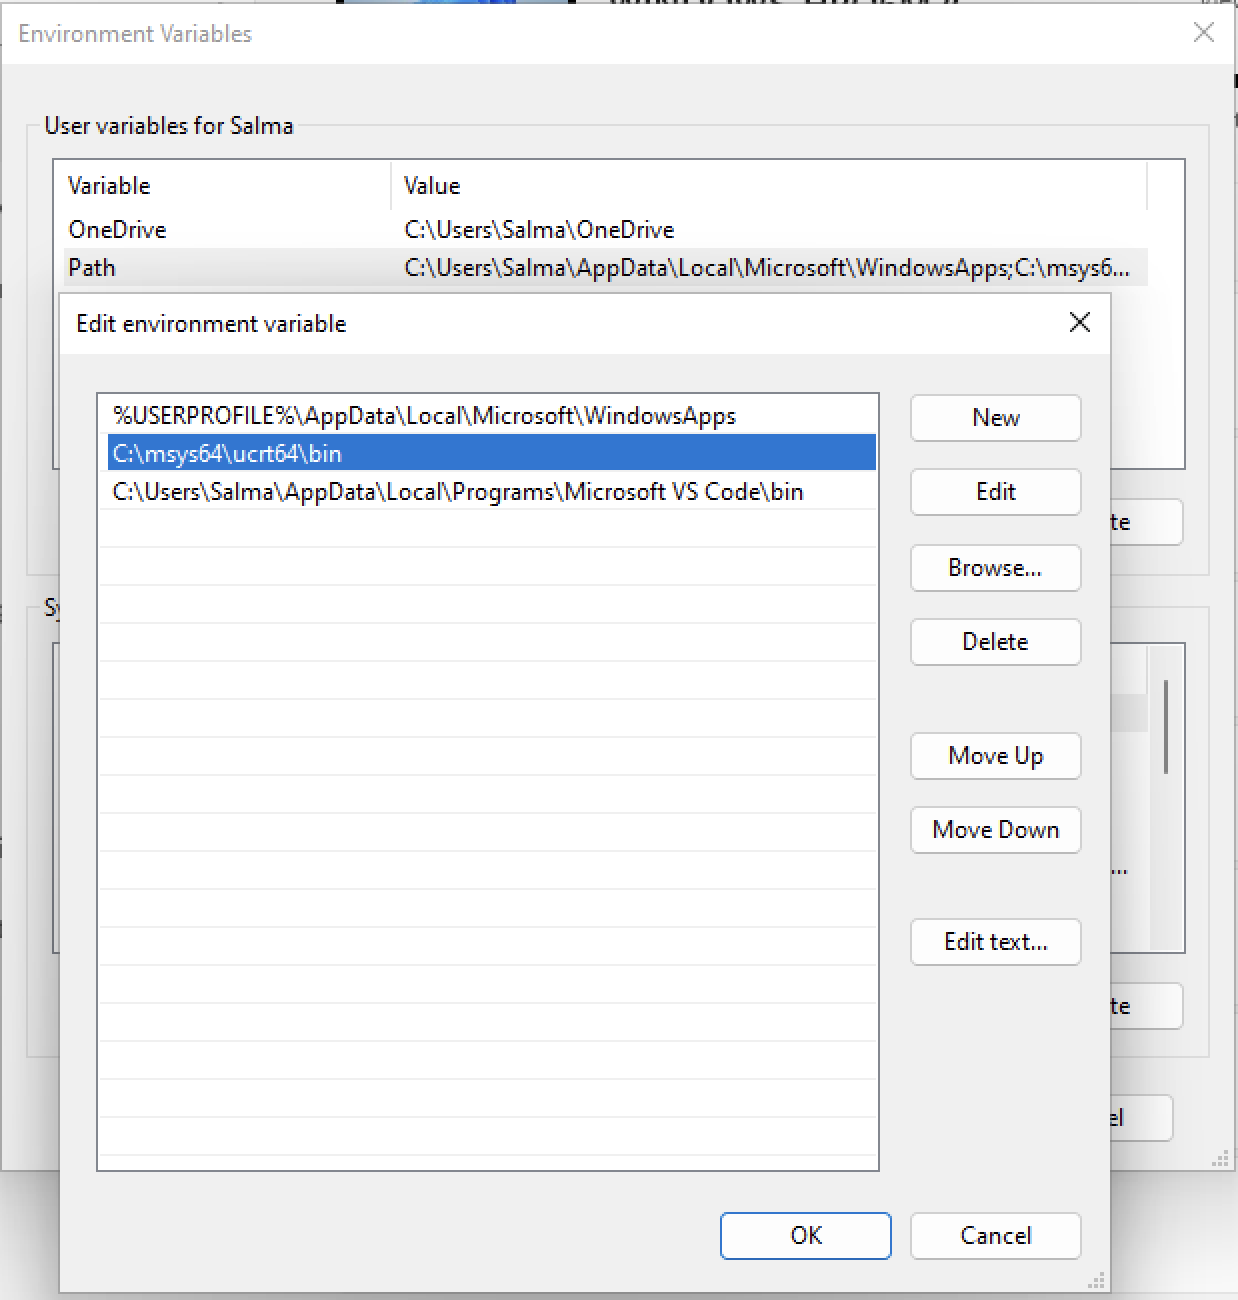
Fig. 1 Edit Path#
[Step 7] Open/Launch Visual Studio Code.
For Mac/Linux Users#
You can follow along the following video for steps on setting up VS Code on Mac/Linux. Brief steps are also provided below.
[Step 1] Go to code.visualstudio.com, and download VS Code. It will take seconds.
[Step 2] Once the download is complete, open the zip file downloaded by double-clicking the .zip file. It will extract the zip file and install the application. Drag and drop the produced Visual Studio Code Application into the Applications folder.
[Step 3] Before being able to compile, run and debug your program, we need to install the necessary C compiler and debugger. To do so, click on Spotlight Search, type and select Terminal.
[Step 4] Type in the following command in the terminal:
$ xcode-select --install
Please note $ is not part of the command. It may appear as % instead on terminal.
Click “Agree” if you are prompted to agree on a license. Installation will take time depending on your machine’s capacity and Internet connection. It took me \(5\) – \(6\) minutes.
[Step 5] Check if your C compiler has been correctly installed by typing:
$ gcc --version
, to see version number of gcc.
If it is not installed, you will see
gcc: Command not found
[Step 6] Open/Launch Visual Studio Code.
Using VS Code#
[Step 1] To create a new folder, click on Explorer \(\rightarrow\) Open Folder. Navigate to your desired folder \(\rightarrow\) press New Folder. Name your folder aps105-labs and click Create \(\rightarrow\) Open. Make sure your desired folder that contains aps105-labs does not contain any spaces in its path.
[Step 2] Create a new folder in the aps105-labs folder, for example lab0, by clicking on New Folder icon next to aps105-labs on the top left.
[Step 3] Click on lab0, and press the New File icon next to aps105-labs to create a new file.
[Step 4] To compile using VS Code, we need to install two necessary extensions. Go to Extensions below the Explorer icon.
[Step 5] Install C/C++ and C/C++ Runner extensions by clicking on ``Install’’ after you click on each of them.
[Step 6] On the bottom left of your window, you should see Select Folder. This helps you select a particular working folder. In our case, we want to select aps105-labs/lab0.
[Step 7] Write a test code in lab0.c file. Turn on the option of Autosave, so that you do not need to worry about saving your C program every time you make a change. Go to File \(\rightarrow\) Autosave.
[Step 8] To compile your program, press the Compile button towards the bottom left of the screen. To run your program, press the Run button. Any output will be observed in the terminal to the lower half of your VS Code window.
[Step 9] Consistent code is easy to read. Consistency appears in the proper indentation, spacing and appropriate line length. To automatically ensure your code is consistent, you can use the default formatter in VS Code. To do so, go to Settings by clicking on the gear at the bottom left of VS Code window. In the search bar, type “formatter”. Check the Editor: Default Formatter is set to None, and Editor: Format on Save is ticked. This will automatically format your code every time you save. In addition, in the search bar, type “format” and under Extensions \(\rightarrow\) C/C++, set the C_{Cpp}: {Clang}_{format}_{fallback} Style to Google.
This will ensure that your code is formatted according to the Google C++ Style Guide.
[Step 10] Walking through individual lines of your code step by step is called debugging. To debug your code, you need to add a breakpoint. A breakpoint is a line of code where your program will pause at when you click the Debug button at the bottom left next to Compile and Run buttons. To create a breakpoint, you need to hover over the line you want your code to pause at and click there.
[Step 11] Click on the Debug button to start a debugging session. Your code will stop at your breakpoint without executing it, unless you press Step over button. As you step over, you will execute further lines and observe variable values changing on the left. If you want to continue running the program, without debugging further, you can press the Continue button.